Dashboard Overview
The TariffBase dashboard is your central hub for accessing tariff data, trade intelligence, and platform features. It is designed to give you an immediate snapshot of the most important information as soon as you log in.
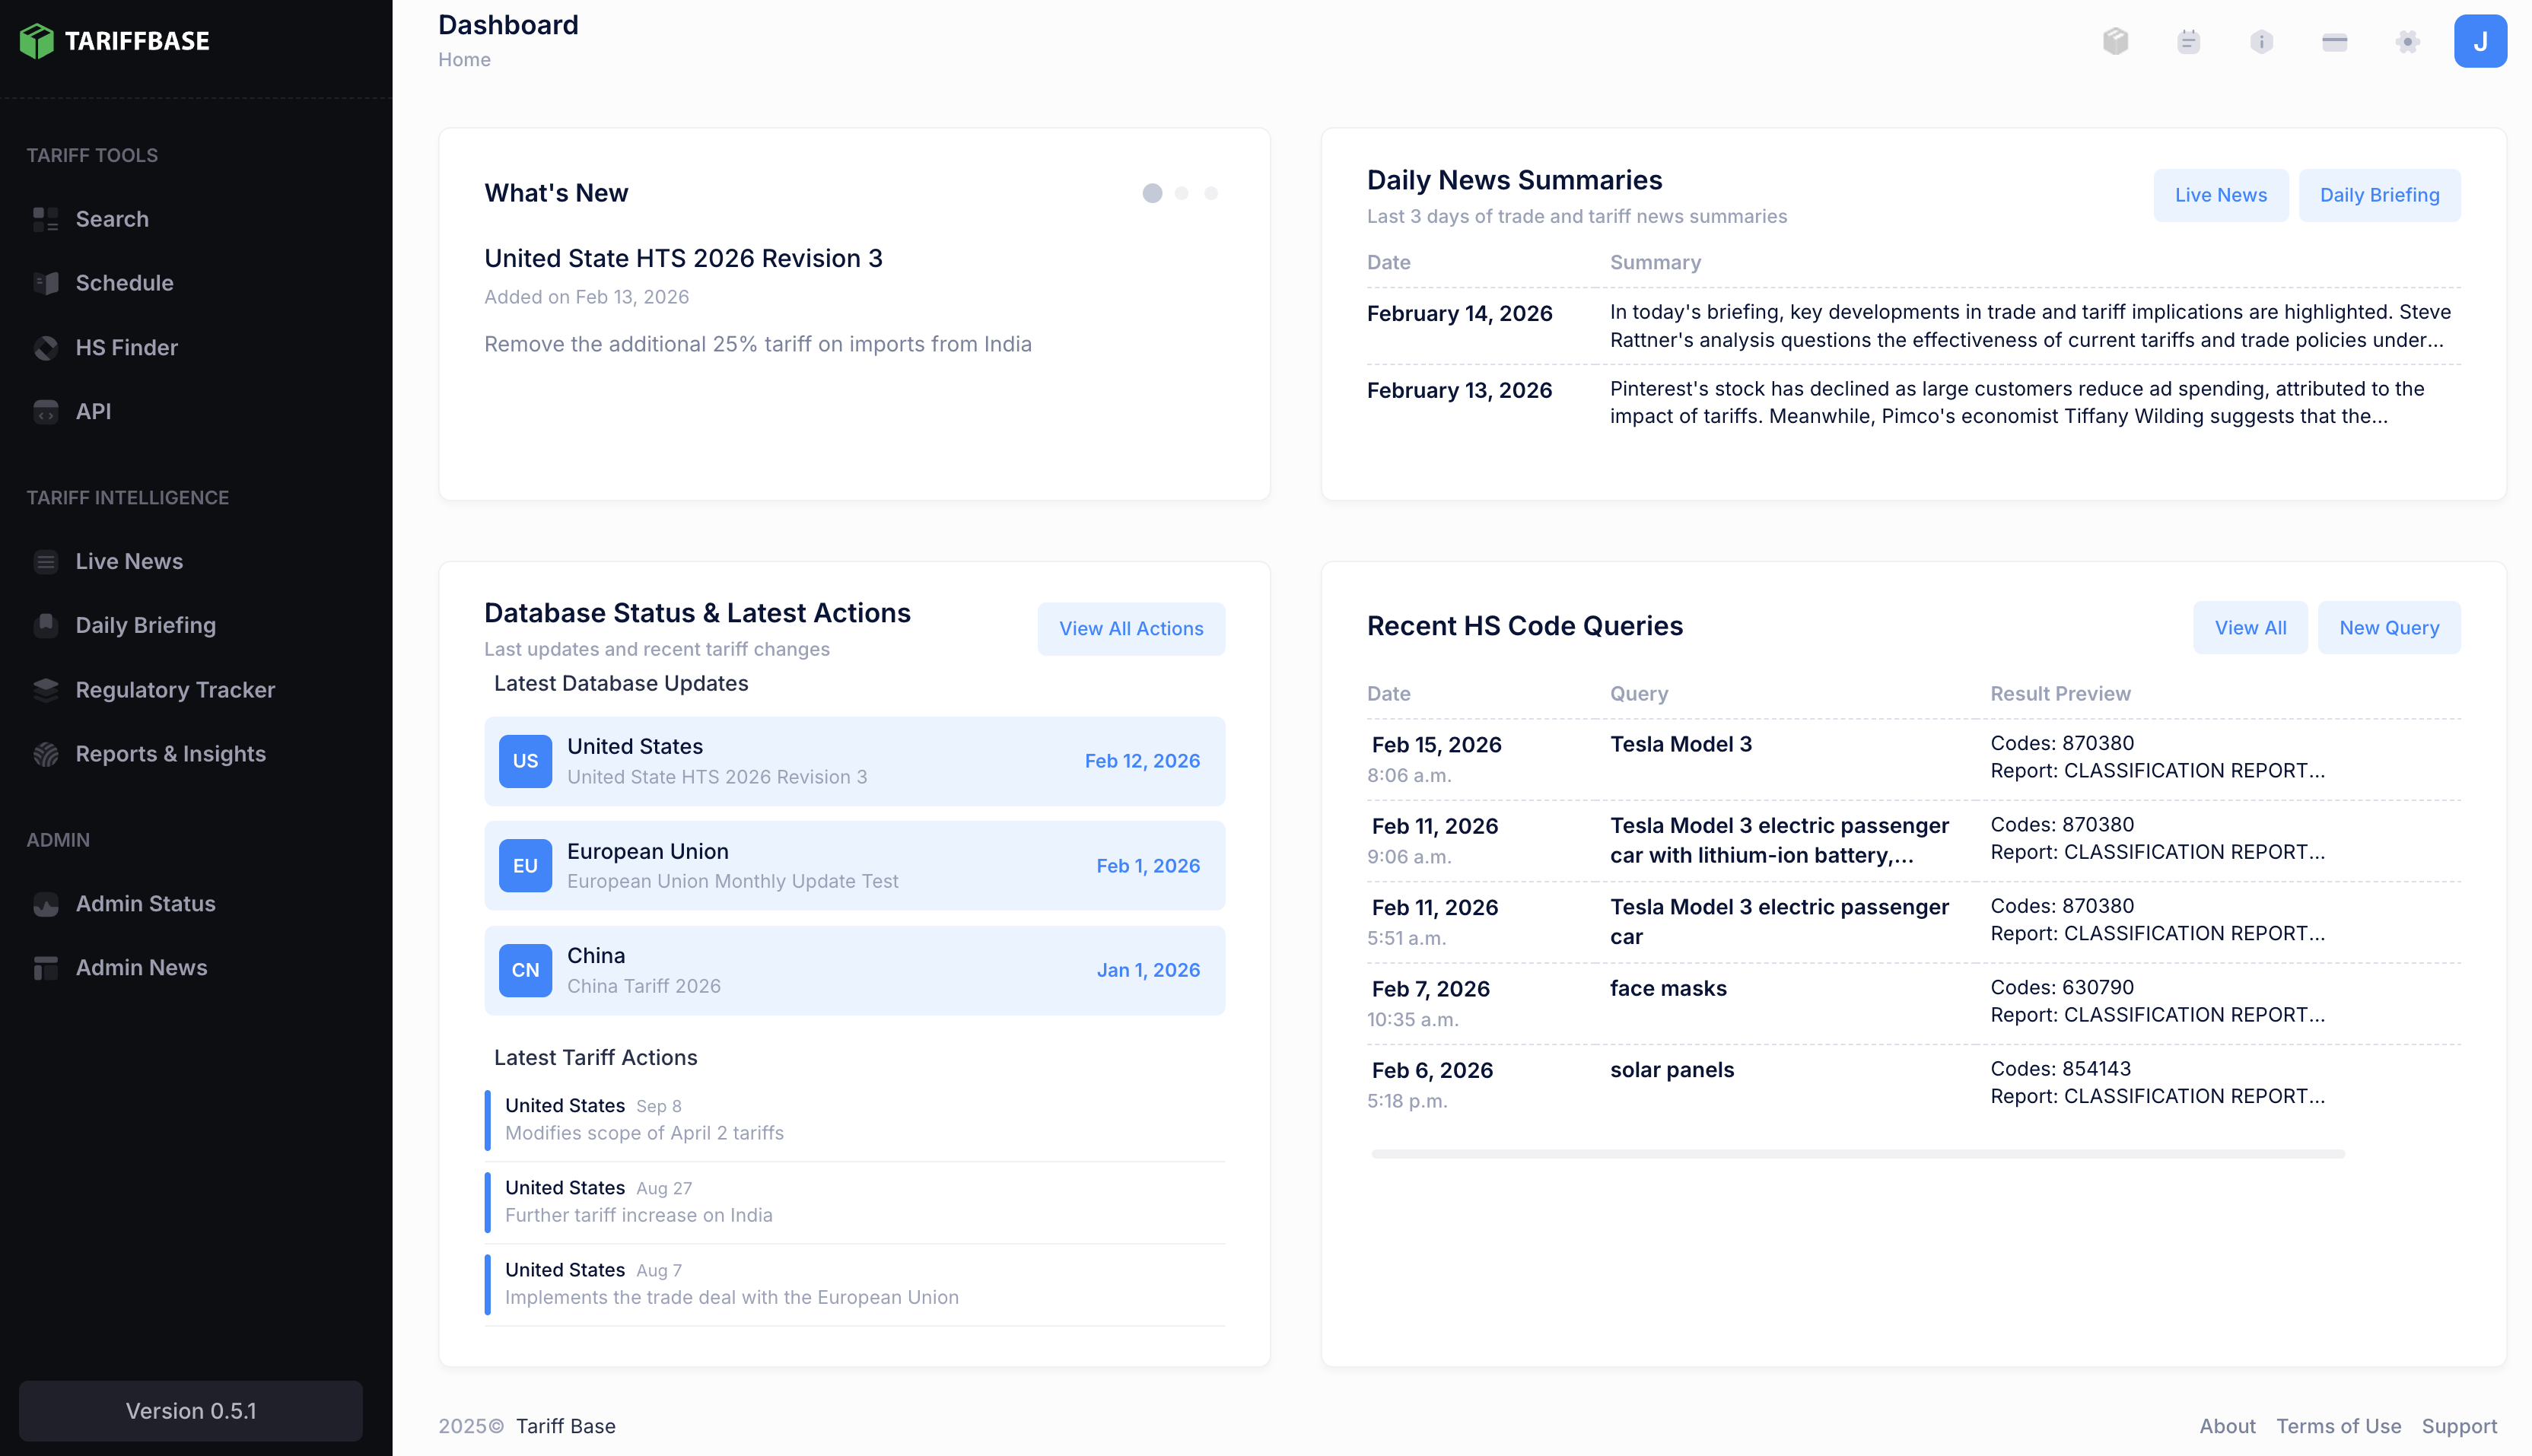
Dashboard Layout
The dashboard is organized into two rows of panels. The top row focuses on platform updates and daily news, while the bottom row shows database status and your recent activity.
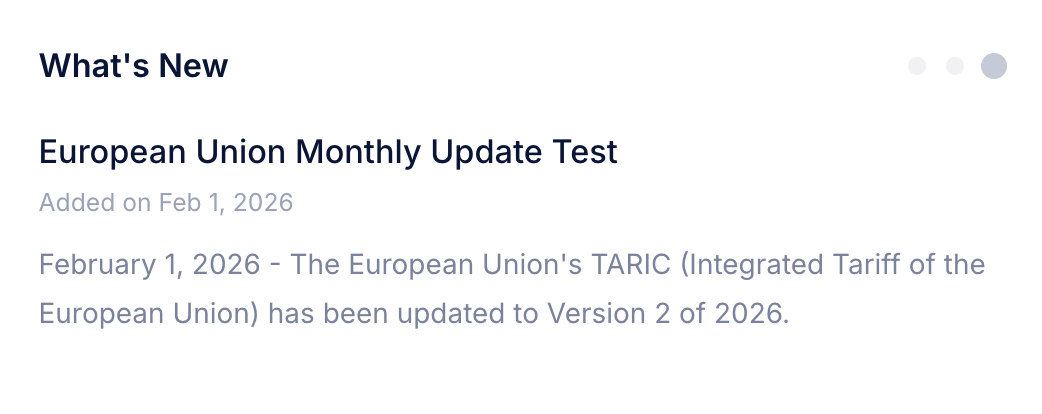
What's New
Location: Top-left panel
The What's New panel is an auto-rotating carousel that highlights recent updates to the TariffBase database. Each slide includes:
- A title describing the update
- The effective date and the date it was added to the platform
- A description with details about the change
- An optional Learn More link for further reading
The carousel advances automatically every 8 seconds. You can also navigate between slides using the dot indicators at the top of the panel. Hovering over the panel pauses auto-rotation so you can read at your own pace.
Example: "United States -- Section 301 China Stage 4A rates updated, effective March 2025"
Tip: Check this panel each time you log in to see if any changes affect your trade corridors.
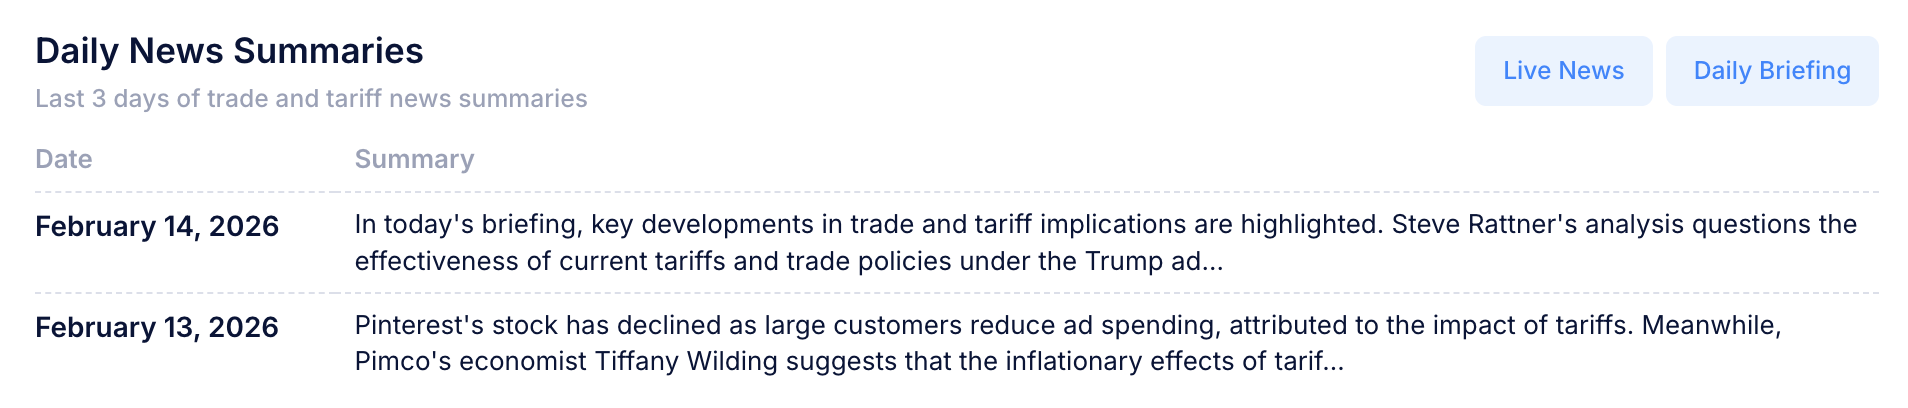
Daily News Summaries
Location: Top-right panel
The Daily News Summaries panel provides a concise table of the most important tariff and trade developments from the last three days. Each row shows:
- The date of the summary
- A preview of the summary text (truncated for readability)
Click on any summary row to open a modal window with the full text of that day's briefing. This is designed to save you time -- instead of reading dozens of articles, you get a short daily briefing on what matters most.
At the top of the panel, two quick-access buttons let you navigate to related features:
- Live News -- opens the full news feed with all recent articles
- Daily Briefing -- opens the complete list of daily summaries
Database Status & Latest Actions
Location: Bottom-left panel
This panel gives you a quick view of how current the TariffBase database is and what tariff actions have occurred recently. It is divided into two sections.
Latest Database Updates
Shows the most recent data update for each of the three covered markets:
| Market | Badge |
|---|---|
| United States | US |
| China | CN |
| European Union | EU |
Each entry displays the market name, a brief description of the update, and the effective date of the latest data in the system. This helps you confirm that the tariff data you are working with is up to date.
Latest Tariff Actions
Below the database updates, the panel lists the three most recent tariff actions from the Regulatory Tracker. Each entry shows:
- The country involved (color-coded for quick identification)
- The effective date of the action
- A brief description of the tariff change
Click View All Actions at the top of the panel to open the full Regulatory Tracker with the complete timeline of tariff actions and policy changes.
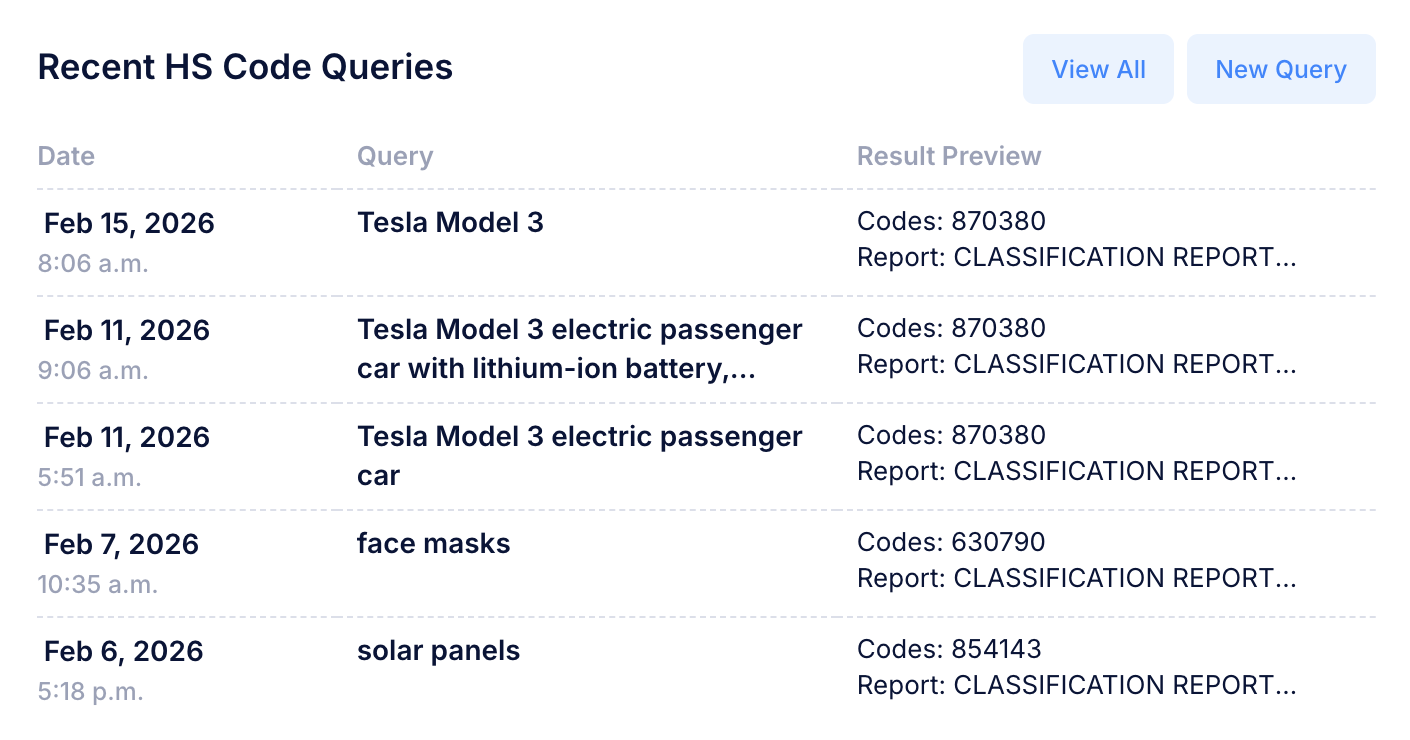
Recent HS Code Queries
Location: Bottom-right panel
The Recent HS Code Queries panel shows your five most recent product classification queries made through the HS Finder tool. Each row includes:
| Column | Description |
|---|---|
| Date | The date and time the query was submitted |
| Query | The product description you entered |
| Result Preview | A truncated preview of the classification result |
Click on any result preview to open a modal window displaying the full query and its complete classification output.
At the top of the panel, two quick-access buttons are available:
- View All -- opens your complete query history
- New Query -- launches the HS Finder tool to start a new classification
If you have not made any queries yet, the panel displays a prompt with a button to Make Your First Query.
Tip: Use this panel to quickly revisit recent classifications without navigating away from the dashboard.
Navigation Sidebar
The left sidebar is your primary way to navigate the platform. It is organized into clear sections:
Tariff Tools
- Search -- Look up tariff rates by destination, origin, and product code
- Schedule -- Browse complete tariff schedules by country and HS chapter
- HS Finder -- Identify HS codes from product descriptions using AI-assisted classification
- API -- Access your API token and integration documentation (Professional plan)
Tariff Intelligence
- News -- Read curated tariff and trade news from credible sources
- Regulatory Tracker -- View an interactive timeline of tariff actions and policy changes
- Reports & Insights -- Browse expert analysis and research papers
Help & Account
- Documentation -- Access this user guide
- Support -- Contact the TariffBase support team
- Account -- Manage your profile, subscription, and billing
- Logout -- Sign out securely
Tip: The sidebar is always accessible, so you can switch between features at any time without losing your place.
Tips for Getting the Most Out of the Dashboard
- Start with What's New -- Scan the carousel for any data changes that may affect your trade corridors.
- Read the Daily Summary -- Spend a minute each morning reviewing the news summaries to stay current on trade developments.
- Check Database Status -- Confirm that the markets you care about have up-to-date data before running searches.
- Review Your Recent Queries -- Use the query history panel to quickly revisit past classifications or pick up where you left off.
Responsive Design
The TariffBase dashboard is fully responsive and works on desktop, tablet, and mobile browsers. The sidebar collapses on smaller screens and can be toggled open with the menu icon. Dashboard panels stack vertically on narrow screens for comfortable reading.
Next Steps
- Tariff Search -- Learn how to look up tariff rates
- Tariff Schedule -- Browse tariff schedules by country
- HS Finder -- Classify products with AI-assisted HS code identification
- News -- Explore the latest trade news
- Regulatory Tracker -- Track tariff actions and policy changes